| STAGE
1: IDENTIFYING POSSIBLE SUCCESS FACTORS |
 |
| What do successful small to mid-size
companies do that others miss? We started by casting our net
very widely. |
|
- Research - we reviewed the scientific
research that has been conducted to isolate possible Success
Factors.
- Experts - we reviewed insights from
high profile international experts as well as highly regarded
but lesser publicized individuals.
- CEOs - we talked in depth with hundreds
of CEOs and reviewed surveys on related topics.
- Experience - we also drew on our own
considerable personal experience in operational and management
roles as well as assisting companies in their efforts.
|
|
The research involves data from literally thousands
of companies with intensive analysis of a core group of over
700 companies from every industry category.
The result was a large pool of potential Success Factors that
provided the fuel for Stage 2. |
|
| |
|
| STAGE
2: MAKING THE CUT |
 |
What we learned from Stage 1 was filtered through
three rigorous screens:
|
|
- Is it True? - Does the potential Success
Factor hold up to scrutiny? If followed, will it produce
the desired results?
- Is it Relevant? - Great advice for
a start-up or a Fortune 500 company is of little use at
this stage of growth. If the finding was not directly
applicable we screened it out.
- Is it Actionable? - Is it something
that you can do something about? Can you actually implement
it? If not, we screened it out.
|
|
| STAGE
3: ORGANIZING FOR UNDERSTANDING |
 |
Next we organized the results, putting like
concepts together. We also made the language consistent and
easy to understand. All the jargon was removed.
Each Success Factor is made up of a series of Components and
detailed criteria that describe and clarify the factor. Our
goal is for each factor to be crystal clear and specific so
they are easy to understand and put into place. |
|
| |
|
| STAGE
4: VALIDATING THE RESULTS |
 |
| To validate the Success Factors we studied
a group of small to mid-size companies (n=68) across a variety
of industries. We divided these companies into three groups
based on the degree that the Success Factors were in place.
|
|
- All - All seven Success Factors were
at least 80% in place.
- Some - Success Factors were less than
80% in place but greater than 20%.
- Few - The seven Success Factors were
each less than 20% in place.
|
|
If the Success Factors are valid, these companies
with more factors in place should perform better. Keep in
mind that all of these companies were "successful,"
i.e. not failing or going out of business.
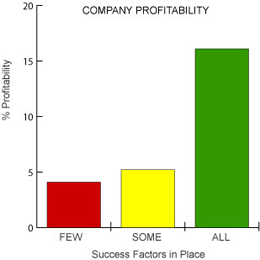
The results were clear and consistent. Those companies with
all of the factors in place were almost four times as profitable
as those with few in place (16.1% vs. 4.1%). Those companies
with some of the Success Factors in place were only a little
better off (5.2%).

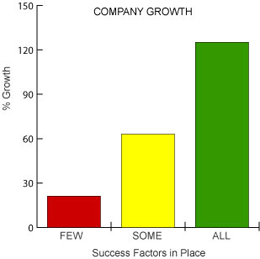
This same pattern held with respect to the rate of growth.
Companies with few Success Factors in place grew at a respectable
rate of 21.2% while those with all factors in place outpaced
them at an impressive 125.1%, a six-fold difference. Companies
with some Success Factors in place were in between at 63.1%.

There were also important quality of life benefits. CEOS in
the firms with the Success Factors in place were six times
more likely to be satisfied with their company’s financial
performance and almost seven times more likely to be able
to concentrate on what they did best and enjoyed the most.
|
|
| |
|
| STAGE
5: HAVE WE MISSED ANYTHING? |
 |
Finally, we went through the process of reviewing
our conclusions and putting them to work in the real world.
Can people understand and implement them? Do they produce
the desired results?
Testing in a variety of companies shows that the Success Factors
can be relatively easy to implement using a step-by-step process.
And importantly, companies show results quickly.
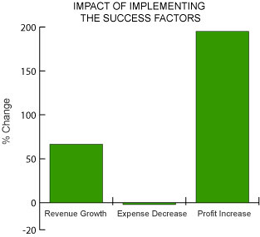
In a study of seven companies who had been implementing the
Success Factors for several months, the companies showed across
the board financial improvement.

In just 6 months, average revenue increased by 66.5%. Expenses
decreased by 2.1%. The result was a surge in profitability
of 195.1%.
These companies recouped an average of $11.21 for every dollar
they invested in implementing the Success Factors in just
two business quarters. In short, these companies experienced
that surge in success that we call the Gemini Effect. |
|
| |
|
| THE Result |
 |
| The product of this extensive process is a
set of powerful Success Factors. Experience and extensive
testing have demonstrated that they can truly make the difference
in your company. |
|